PIMA PRICKLY PARK
A Pima County park being developed in partnership with the
Tucson Cactus & Succulent Society
MEASUREMENTS AND INFRASTRUCTURE
Rain Gauge Data from our Hoop House area is available online at the RainLog web site. We enter our data into the RainLog site about every six months. On their Web site map, zoom to the park area to see the readings (look for where the Rillito River turns north by Interstate 10).
Temperature data is collected every 15 minutes and can be directly loaded into a spreadsheet. It is a .csv formatted file which also includes rain data in 0.01 inch increments, time stamped each time the bucket tips which is 0.01" of rain.
Select graph or range of data from list below.
- From 5/16/12 to 8/04/12 data
- From 8/04/12 to 12/23/12 data
- From 10/23/12 to 1/21/13 data graph
- From 1/21/13 to 7/16/1 data graph
- From 7/16/13 to 9/12/13 data graph
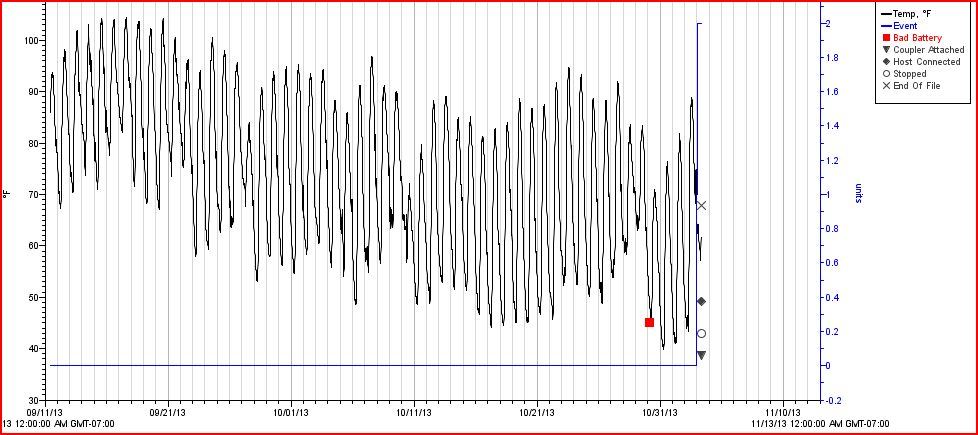
- From 9/12/13 to 11/03/13 data graph
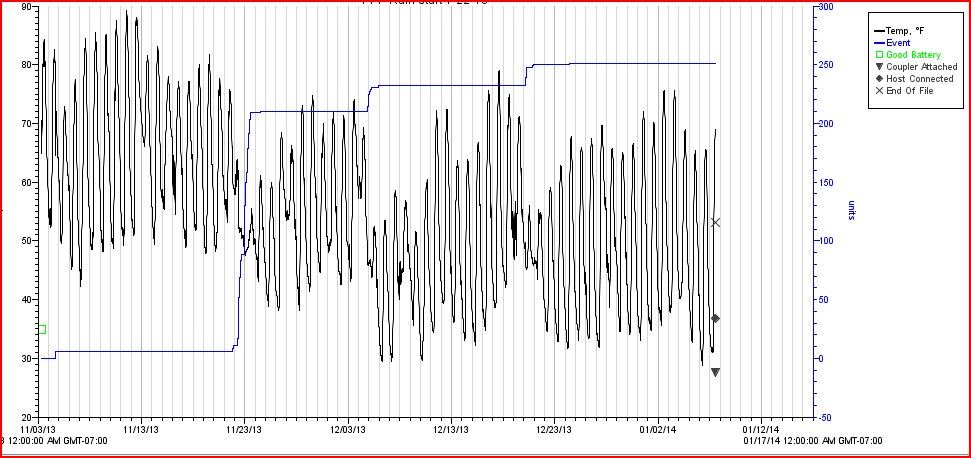
- From 11/03/13 to 1/07/14 data graph
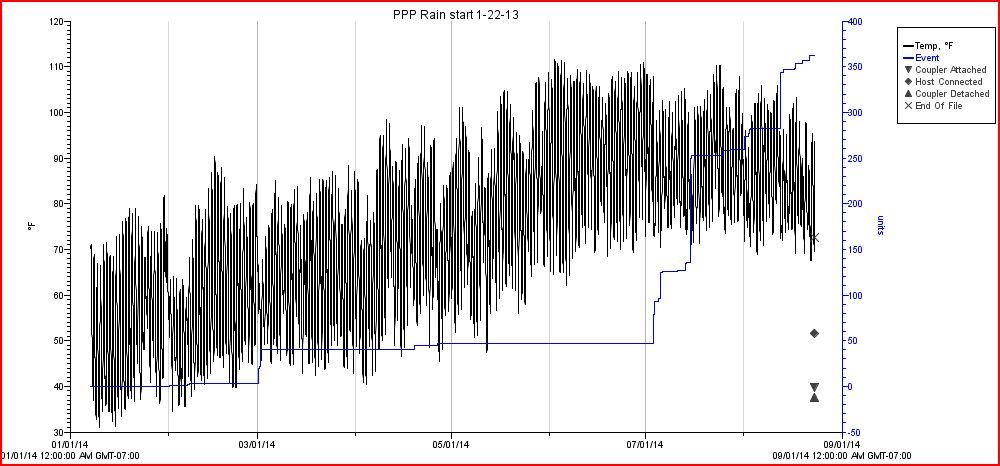
- From 1/07/14 to 8/23/14 data graph
- From 8/23/14 to 2/06/15 data
- From 2/06/15 to 8/30/15 data
- From 9/01/15 to 6/19/16 data
- From 6/19/16 to 9/18/16 data
- From 9/19/16 to 7/23/17 data
- From 7/24/17 to 12/13/18 data
- From 12/14/18 to 4/18/19 missing
- From 4/20/19 to 1/14/20 data
- From 1/14/20 to 11/5/20 data
Note:Data from 12/14/18 to 4/18/19 was not captured due to HOBO Memory being full. Rain data was estimated using nearby stations for graphs


• Slide show photos of the February 2012 Hoop House Hoops construction project.
• Slide show photos of the February 2012 Hoop House Fencing construction project
RAMADAS - There are three ramadas in the park, two have picnic tables
 |
 |
PATHS AND SIGNAGE
 |